Gauges
The second metric type we need to know about is a Gauge.
Gauges are very similar to Counters in that they are a floating point value that starts initialized to zero, however a Gauge can go both up and down and has the potential to be either a positive or negative number.
Gauges are useful metrics for tracking a specific internal state value that fluctuates up and down throughout service lifetime:
- Temperature of a sensor
- Bytes of memory currently allocated
- Number of pending requests in the queue
- Number of active routines
- Number of active TCP connections
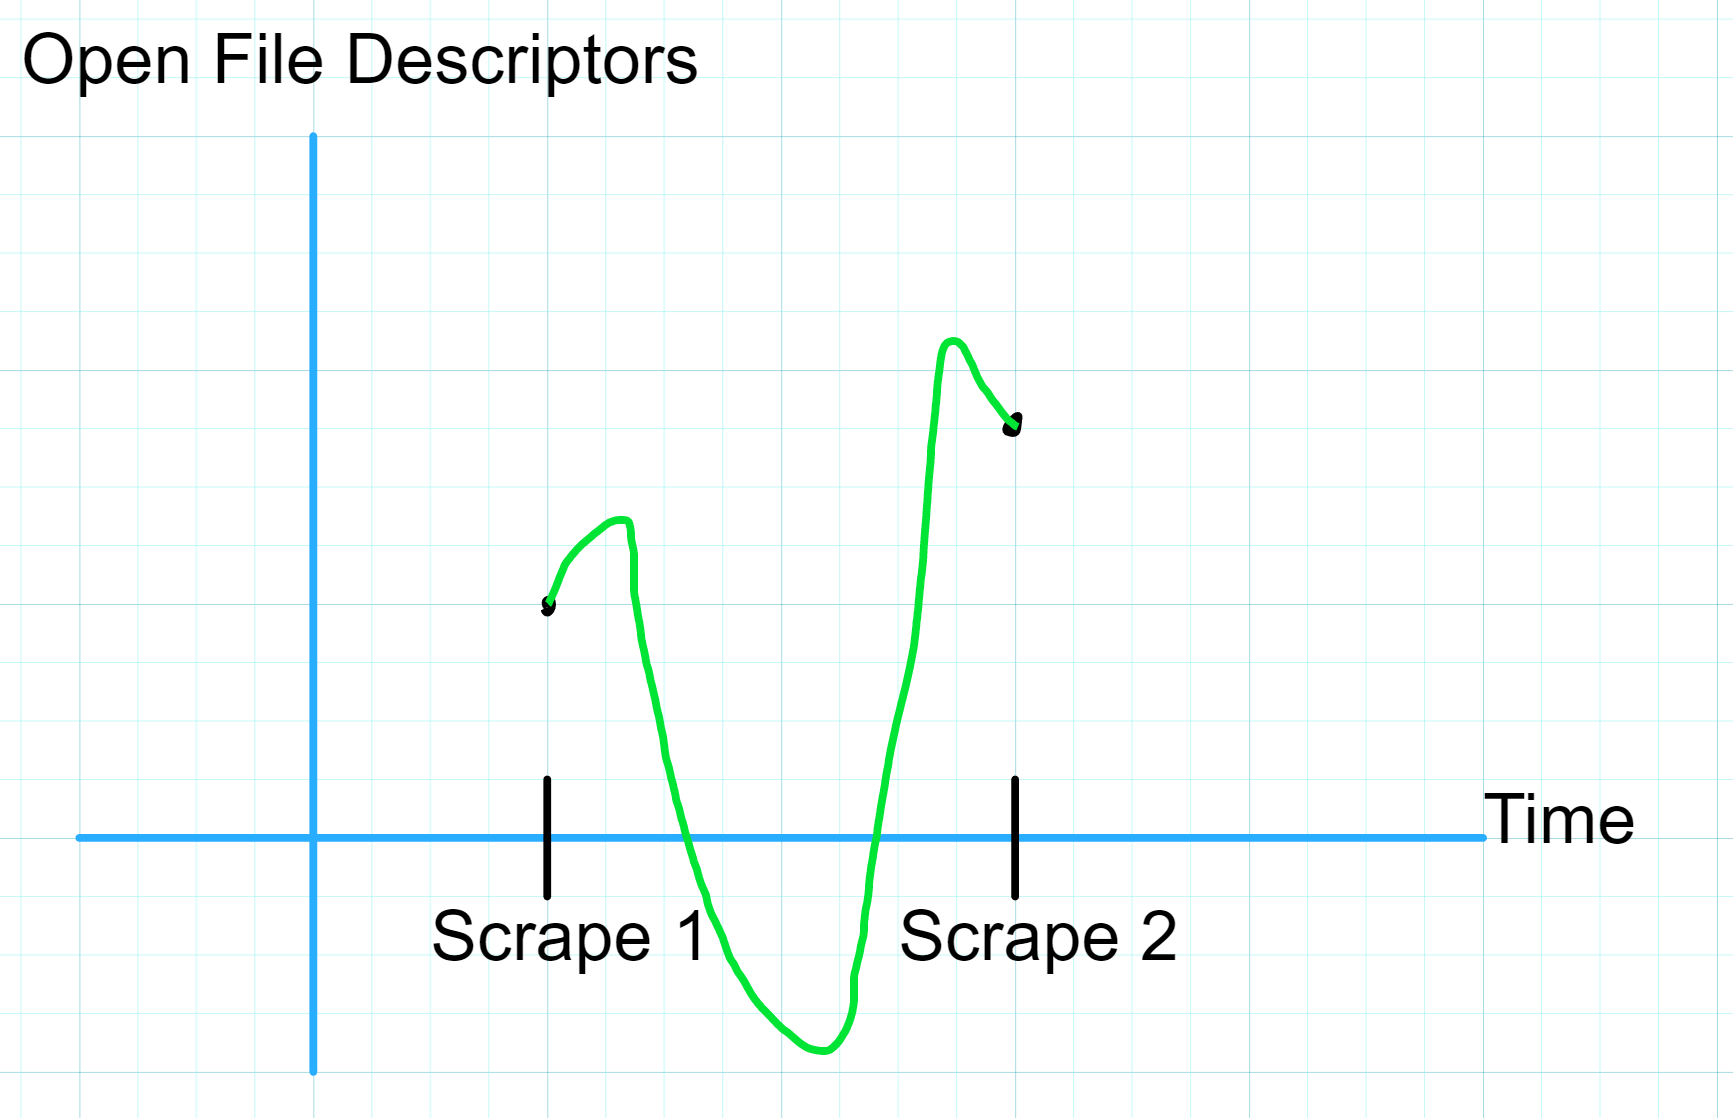
- Number of open File Descriptors
In our example payload, the Gauge metric is represented as follows:
# HELP process_open_fds Number of open file descriptors.
# TYPE process_open_fds gauge
process_open_fds 16
Gauges are useful to interrogate the immediate internal state of a service at a given point in time.
Unlike with Counters, calculating the rate() of a Gauge doesn't really make sense since Gauge values can go up and down between observations.
We are unable to interpolate between two observations of a Gauge since we don't know the boundaries of possible values for the Gauge between the observations.

In the absence of a rate() style query, how can we contextualize a Gauge metric?
Prometheus provides us with additional Range Vector functions to help interpret the values of Gauges by aggregating observations over time.
In the previous chapter on Counters, I introduce a concept of a Range Vector and walk through how the rate() query operates on such vectors. We'll be using Range Vectors below so feel free to go back and review if you need a refresher.
Below is a list of a few of the functions we can use to better understand what our Gauge is telling us about our service:
avg_over_time()- Take all values in the range vector, add them up, and divide the sum by the number of observations in the vector.
min_over_time()- Take the lowest value in the range vector (remember, Gauge values can be both positive or negative).
max_over_time()- Take the highest value in the range vector.
sum_over_time()- Take all values in the range vector and add them up.
quantile_over_time()- Keep reading for a breakdown.
There are a few others available to us but for the purposes of this chapter we'll explore the above five functions in a practical scenario.
The Quantile Function
The Quantile Function is a commonly used function in probability theory and statistics but I am neither a statistician or probabilist.
Thankfully we don't need probability theory to understand what quantile_over_time() does and how it works.
Given a Range Vector (list of successive observations of a Gauge) vec and a target Quantile of 0.90, quantile_over_time(0.90, vec) returns the value at the 90th percentile of all observations in vec.
Recall that the 50th percentile of a series of numbers, also called the median, is the member of the series at which half of the remaining numbers in the series fall below and the other half fall above.
For a sample series:
[25, 45, 34, 88, 76, 53, 91, 21, 53, 12, 6, 37, 97, 50]
We find the median by sorting the series least-to-greatest and picking the value in the middle, or in the case of a series of even length, we average the two middle-most numbers.
[6, 12, 21, 25, 34, 37, (45, 50), 53, 53, 76, 88, 91, 97]
\[ \frac{45 + 50}{2} = 47.5\]
So in this example our median is 47.5 which is the same as the 50th percentile of the series.
Okay, so what does that make the 90th percentile? Well the 90th percentile of a series is the value for which 90% of the numbers in the series fall below and 10% of the numbers in the series fall above.
So given our example series, how do we find the 90th percentile?
Well if we have an ordered series of numbers, we'd want to grab the value at position 0.9 * n where n is the number of values in the series, since that would split the series into two chunks, one with 90% of the values and one with 10% of the values. In our example series, we have 14 values, so we'd take the value at position 0.9 * 14 = 12.6.
Since our series has 14 numbers in it, it is impossible to find a value at which exactly 90% of the values fall below it and 10% fall above it (14 is not divisible by 10), so we can estimate the 90th percentile for our series by taking the weighted average of the values on either side of the split point.
[6, 12, 21, 25, 34, 37, 45, 50, 53, 53, 76, (88, 91), 97]
\[ (88 * (1-0.6)) + (91 * 0.6) = 89.8\]
Now that we've cleared that up, it should be easy to get the 75th percentile of our Range Vector (or any other percentile we need), just use quantile_over_time(0.75, vec).
If we look at the implementation of the quantile_over_time() function in the Prometheus source we see a fairly straightforward Go function that does the same process we just walked through:
// quantile calculates the given quantile of a vector of samples.
// ...
func quantile(q float64, values vectorByValueHeap) float64 {
	//...
	sort.Sort(values)

	n := float64(len(values))
	// When the quantile lies between two samples,
	// we use a weighted average of the two samples.
    // Multiplying by (n-1) because our vector starts at index 0 in code
	rank := q * (n - 1)

	lowerIndex := math.Max(0, math.Floor(rank))
	upperIndex := math.Min(n-1, lowerIndex+1)

	weight := rank - math.Floor(rank)
	return values[int(lowerIndex)].V*(1-weight) + values[int(upperIndex)].V*weight
}
Querying Gauge Metrics
Now let's put these functions into practice and learn a bit about our example metric, process_open_fds.
TODO: write about querying Gauge metrics